 Login/Register


The matrix effect in immunoassays: avoiding it in your ELISA and multiplex assays
The use of immunoassays for the quantification of analytes in biological samples like plasma, serum, and tissue homogenates can be challenging. While endogenous antibodies can interfere by cross-linking or blocking, there are many components in these samples, such as carbohydrates, proteins, and phospholipids that can interfere with the ability of the antibody pairs to bind to their target. This phenomenon is known as the "Matrix Effect". By following these guidelines, you will be able to determine whether you are running into any issues with regards to your samples and the matrix effect, as well as learn how to take steps to correct it.
Are you experiencing the matrix effect?
The most obvious sign you are dealing with the matrix effect is that you are obtaining OD readings much lower than expected. However, be aware that low OD readings can be due to other factors, such as low concentration of analyte in the sample or too short of an incubation time. In order to determine if you are indeed encountering a problem with the matrix, you can perform a spike and recovery assay.
Spike and recovery measurements will allow you to assess if your sample matrix (plasma, serum, etc.) is causing interference with the ability of the capture and detection antibodies to bind to the target protein being assayed. By adding, or "spiking", a known concentration of the recombinant standard into your sample and comparing this to the same concentration of recombinant spiked into the standard diluent, or blank, you can assess whether anything in your sample matrix is causing interference. You should always include your sample without spiked recombinant so you are able to measure any endogenous protein that may already be there. All three of these samples are measured, and concentrations are determined relative to the standard curve.
In a perfect world, your recovery would be 100%. Ideally, you should aim between 80-120%.
What does that all mean and how do I determine the percent recovery?
To calculate percent recovery:
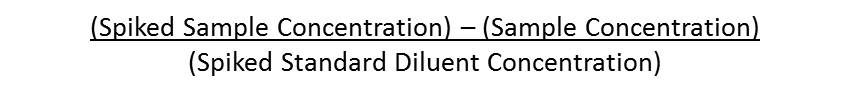
- If the concentrations measured for both your spiked standard diluent and spiked sample are the same, the matrix is not your problem, and you will have 100% recovery.
- If the concentrations measured for your spiked standard diluent and spiked sample are relatively close, the matrix is not a problem, and you will have ~80-120% recovery.
- If the concentrations measured for your spiked standard diluent and spiked sample are very different, the matrix IS your problem, and you will have <80% recovery.
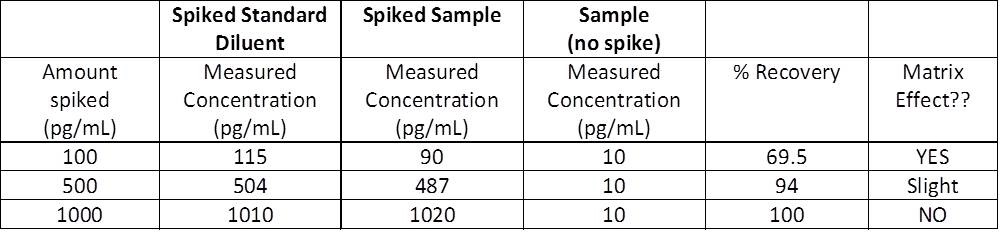
Sample Spike and Recovery Measurements
How do you overcome the matrix effect?
There are a couple of ways you can do this:
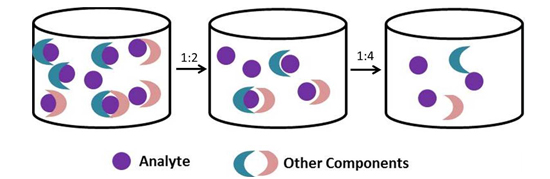
The easiest way to overcome the matrix is to dilute your samples. Generally, it is a good rule of thumb to dilute biological samples at least two-fold with the same buffer used to dilute your recombinant standards. You can dilute further, but you need to ensure that your samples will still fall within the linear range of the standard curve and that you take this dilution factor into account when analyzing your data.
If you need to further dilute your biological samples to overcome this matrix effect, or expect high levels of analyte in your samples, you will want to dilute your samples AND standards in a similar matrix. Why dilute the standards as well? You need to ensure that your standards undergo a similar matrix effect as that of your samples.
If I am diluting my standards and samples with the Matrix Diluent, do I need to account for that dilution factor when analyzing my data?
We have included specially formulated 'Matrix Diluents' in many of our ELISA and LEGENDplex™ multiplex assays in order to counteract the matrix effect. Several of our ELISA and LEGENDplex™ kits ask you to dilute your standards in matrix buffers when working with serum or plasma samples in order to account with potential presence of the matrix effect. The final values that you report for your assay depend on what you want to calculate a concentration for - do you want to calculate the concentration in the actual sample or the total concentration in the well? There are two different scenarios:
Scenario A:
This is how BioLegend performs the calculations. If you are looking to only measure the concentration in your actual sample, you will keep the concentrations listed in the manual for the standard curve. There will be no need to account for the 2-fold dilution factor because both the standards AND samples have been diluted 1:1.
However, if you diluted your samples PRIOR to this, this dilution factor would need to be accounted for.
| Manual Instructions: Top Standard Concentration: 1000 pg/mL, 50 μL standards + 50 μL samples per well. | 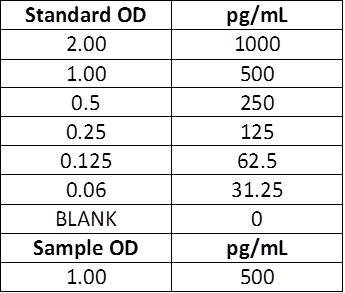 |
Scenario B:
If you prefer to measure the total concentration in the well, the standard values will need to be halved. After running the ELISA, the concentrations measured are the total concentrations in that well. To determine the concentration that is actually in your sample, you need to account for the 2-fold dilution. Any prior dilutions, as mentioned above, will also need to be accounted for.
| Manual Instructions: Top Standard Concentration: 500 pg/mL, 50 μL standards + 50 μL samples per well Actual sample concentration: Calculated concentration (250 pg/mL) x Dilution factor (2) = Actual concentration (500 pg/mL) |
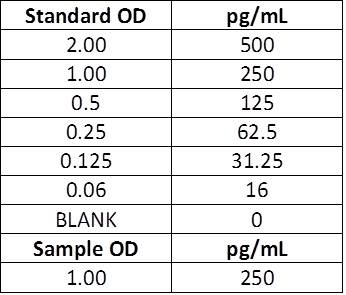 |
Actual sample concentration: Calculated concentration (250 pg/mL) x Dilution factor (2) = Actual concentration (500 pg/mL)
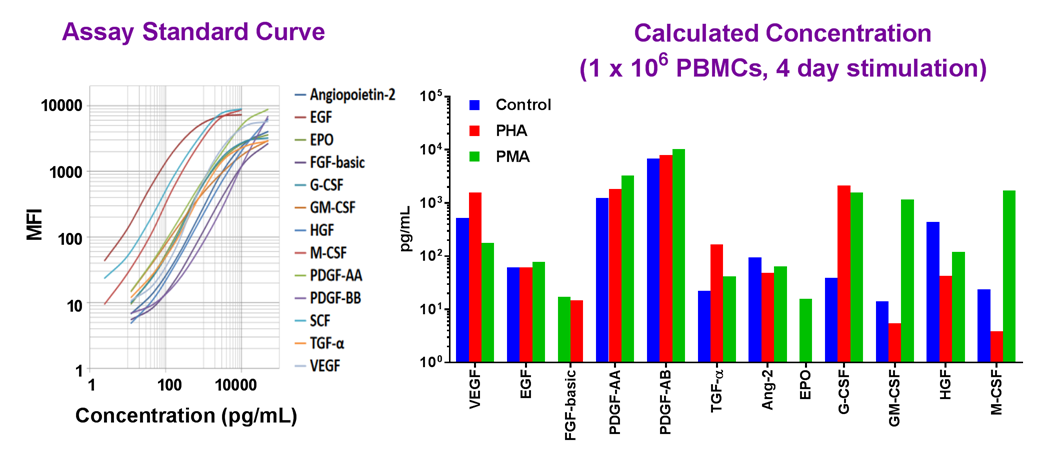
Example dataset and standard curve generated using the LEGENDplex™ Human Growth Factor Panel for demonstration purposes. Serum samples from PBMCs were treated with activators PHA or PMA, and tested for endogenous levels of growth factors proteins. A standard curve must be run with each assay. Data (right) shows simultaneous quantification of key targets in PBMCs.
Our featured LEGENDplex™ Human Growth Factor Panel V02 is a bead-based multiplex assay panel that quantifies 13 key targets involved in growth factor signaling. It allows simultaneous quantification of 13 human growth factors, which include VEGF, EGF, HGF, TGF-α, FGF-basic, and PDGF. This panel has been validated for use on cell culture supernatant, serum, and plasma samples.
Epidermal growth factor receptor (EGFR), also known as ErbB-1 or HER1 in humans, is a transmembrane protein that acts as a receptor for members of the epidermal growth factor family (EGF family) of extracellular protein ligands. EGFR is activated by binding to specific ligands, such as epidermal growth factor and transforming growth factor alpha (TGF-α). Overexpression and mutations affecting EGFR can play a role in various cancer types1, making EGFR a key target for cancer therapy-related immunoassays*.
Binding of a ligand to the extracellular domain of EGFR results in receptor dimerization and autophosphorylation on tyrosine residues with the major phosphorylation sites being tyrosine 1068 (Tyr1068), Tyr1148, and Tyr1173. Phosphorylation of Tyr1173 leads to interaction with Shc and phospholipase Cγ (PLCγ), which are involved in the activation of MAPK signaling pathway. EGFR activation triggers intracellular signaling that results in increased proliferation and a number of processes related to cell survival.
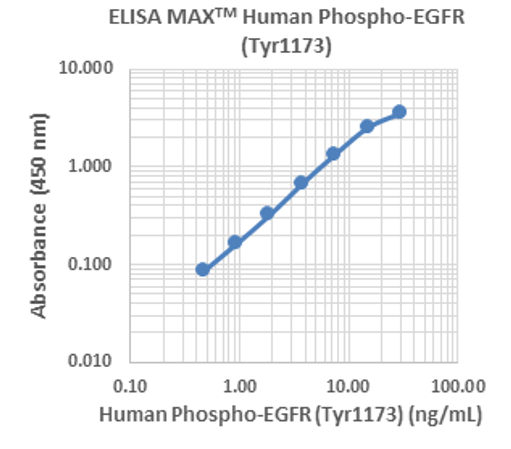 |
Our ELISA MAX™ Deluxe Set Human Phospho-EGFR (Tyr1173) is designed for the accurate quantification of endogenous or recombinant human phosphorylated EGFR (Tyr1173). This standard curve was generated using the ELISA MAX™ Human Phospho-EGFR (Tyr1173) for demonstration purposes only. A standard curve must be run with each assay. |
Revvity’s HTRF Human Phospho-EGFR (Tyr1068) Detection Kit is designed for cell-based quantitative detection of Tyr1068 phosphorylation on EGFR. Phosphorylation of EGFR at Tyr1068 has been studied as a potential biomarker for sensitivity to tyrosine kinase inhibitors (TKIs) in preclinical models of cancer2.
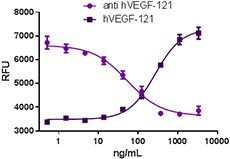 |
Recombinant human VEGF-121 stimulates proliferation of HUVEC in a dose-dependent manner (dark purple squares). Proliferation induced by recombinant human VEGF-121 (15 ng/mL) is neutralized (purple circles) by increasing concentrations of anti-VEGF-121 (clone A15136B) antibody. The ND50 is typically 25 - 100 ng/mL. VEGF (also known as VEGF-A) is a signaling protein with strong vascular permeability activity that stimulates the formation of new blood vessels during the processes of vasculogenesis and angiogenesis3. |
Our immunoassays are designed for hundreds of targets including for multiple cytokines and growth factors. Interrogate crucial pathways using our multiplex panels or focus on individual targets with our ELISA kits and sets. Increasing our understanding of growth factor biology will yield insights into the array of processes linked to growth factors, including many that are implicated in human health and disease, like development and cancer.
Summary
When running an immunoassay, it is important to determine whether there are any issues with your samples and if the matrix effect is present. Minimizing matrix interference ensures reliable data for research studies and antibody development. While reagent concentrations might need to be optimized to minimize interference, some alternate testing methods include serial dilution to verify analyte recovery and blocking agents to avoid endogenous interference.
Analyze your immunoassay data with confidence with our resources for immunoassays. To view our complete solutions and find resources for choosing the right assay, visit our immunoassays webpage. For more information on our ELISAs and LEGENDplex™ multiplex panels, contact our Technical Services Team. If you have additional questions regarding the matrix effect or troubleshooting in general, check out our ELISA Troubleshooting Guide.
References
- Tate J, Ward G. Interferences in immunoassay. Clin Biochem Rev. 2004. 25(2):105-20. PMID: 18458713; PMCID: PMC1904417.
- Sette, G., Salvati, V., Mottolese, M. et al. Tyr1068-phosphorylated epidermal growth factor receptor (EGFR) predicts cancer stem cell targeting by erlotinib in preclinical models of wild-type EGFR lung cancer. Cell Death Dis. 2015; 6, e1850. DOI:10.1038/cddis.2015.217
- Shibuya M. Vascular endothelial growth factor and its receptor system: physiological functions in angiogenesis and pathological roles in various diseases. J Biochem. 2013;153(1):13-9. DOI: 10.1093/jb/mvs136. PMID: 23172303; PMCID: PMC3528006.
Reagents discussed are designed for research use only. Not for use in diagnostic procedures*.


Follow Us